Clustering/Graphing
Revision as of 08:54, 21 October 2022 by Jonny (talk | contribs) (Created page with "Up to: Clustering Idk some late night clustering. see ya tomorrow :) class="img-responsive" <syntaxhighlight lang="python"> from autopilot.utils import wiki import requests import graphviz import networkx as nx import pdb from matplotlib import pyplot as plt def unnest(entries:dict): unnested = [] for entry in entries: entry_name = list(entry.keys())[0] nested_entry = entry[entry_name] unnest_entry...")
Up to: Clustering
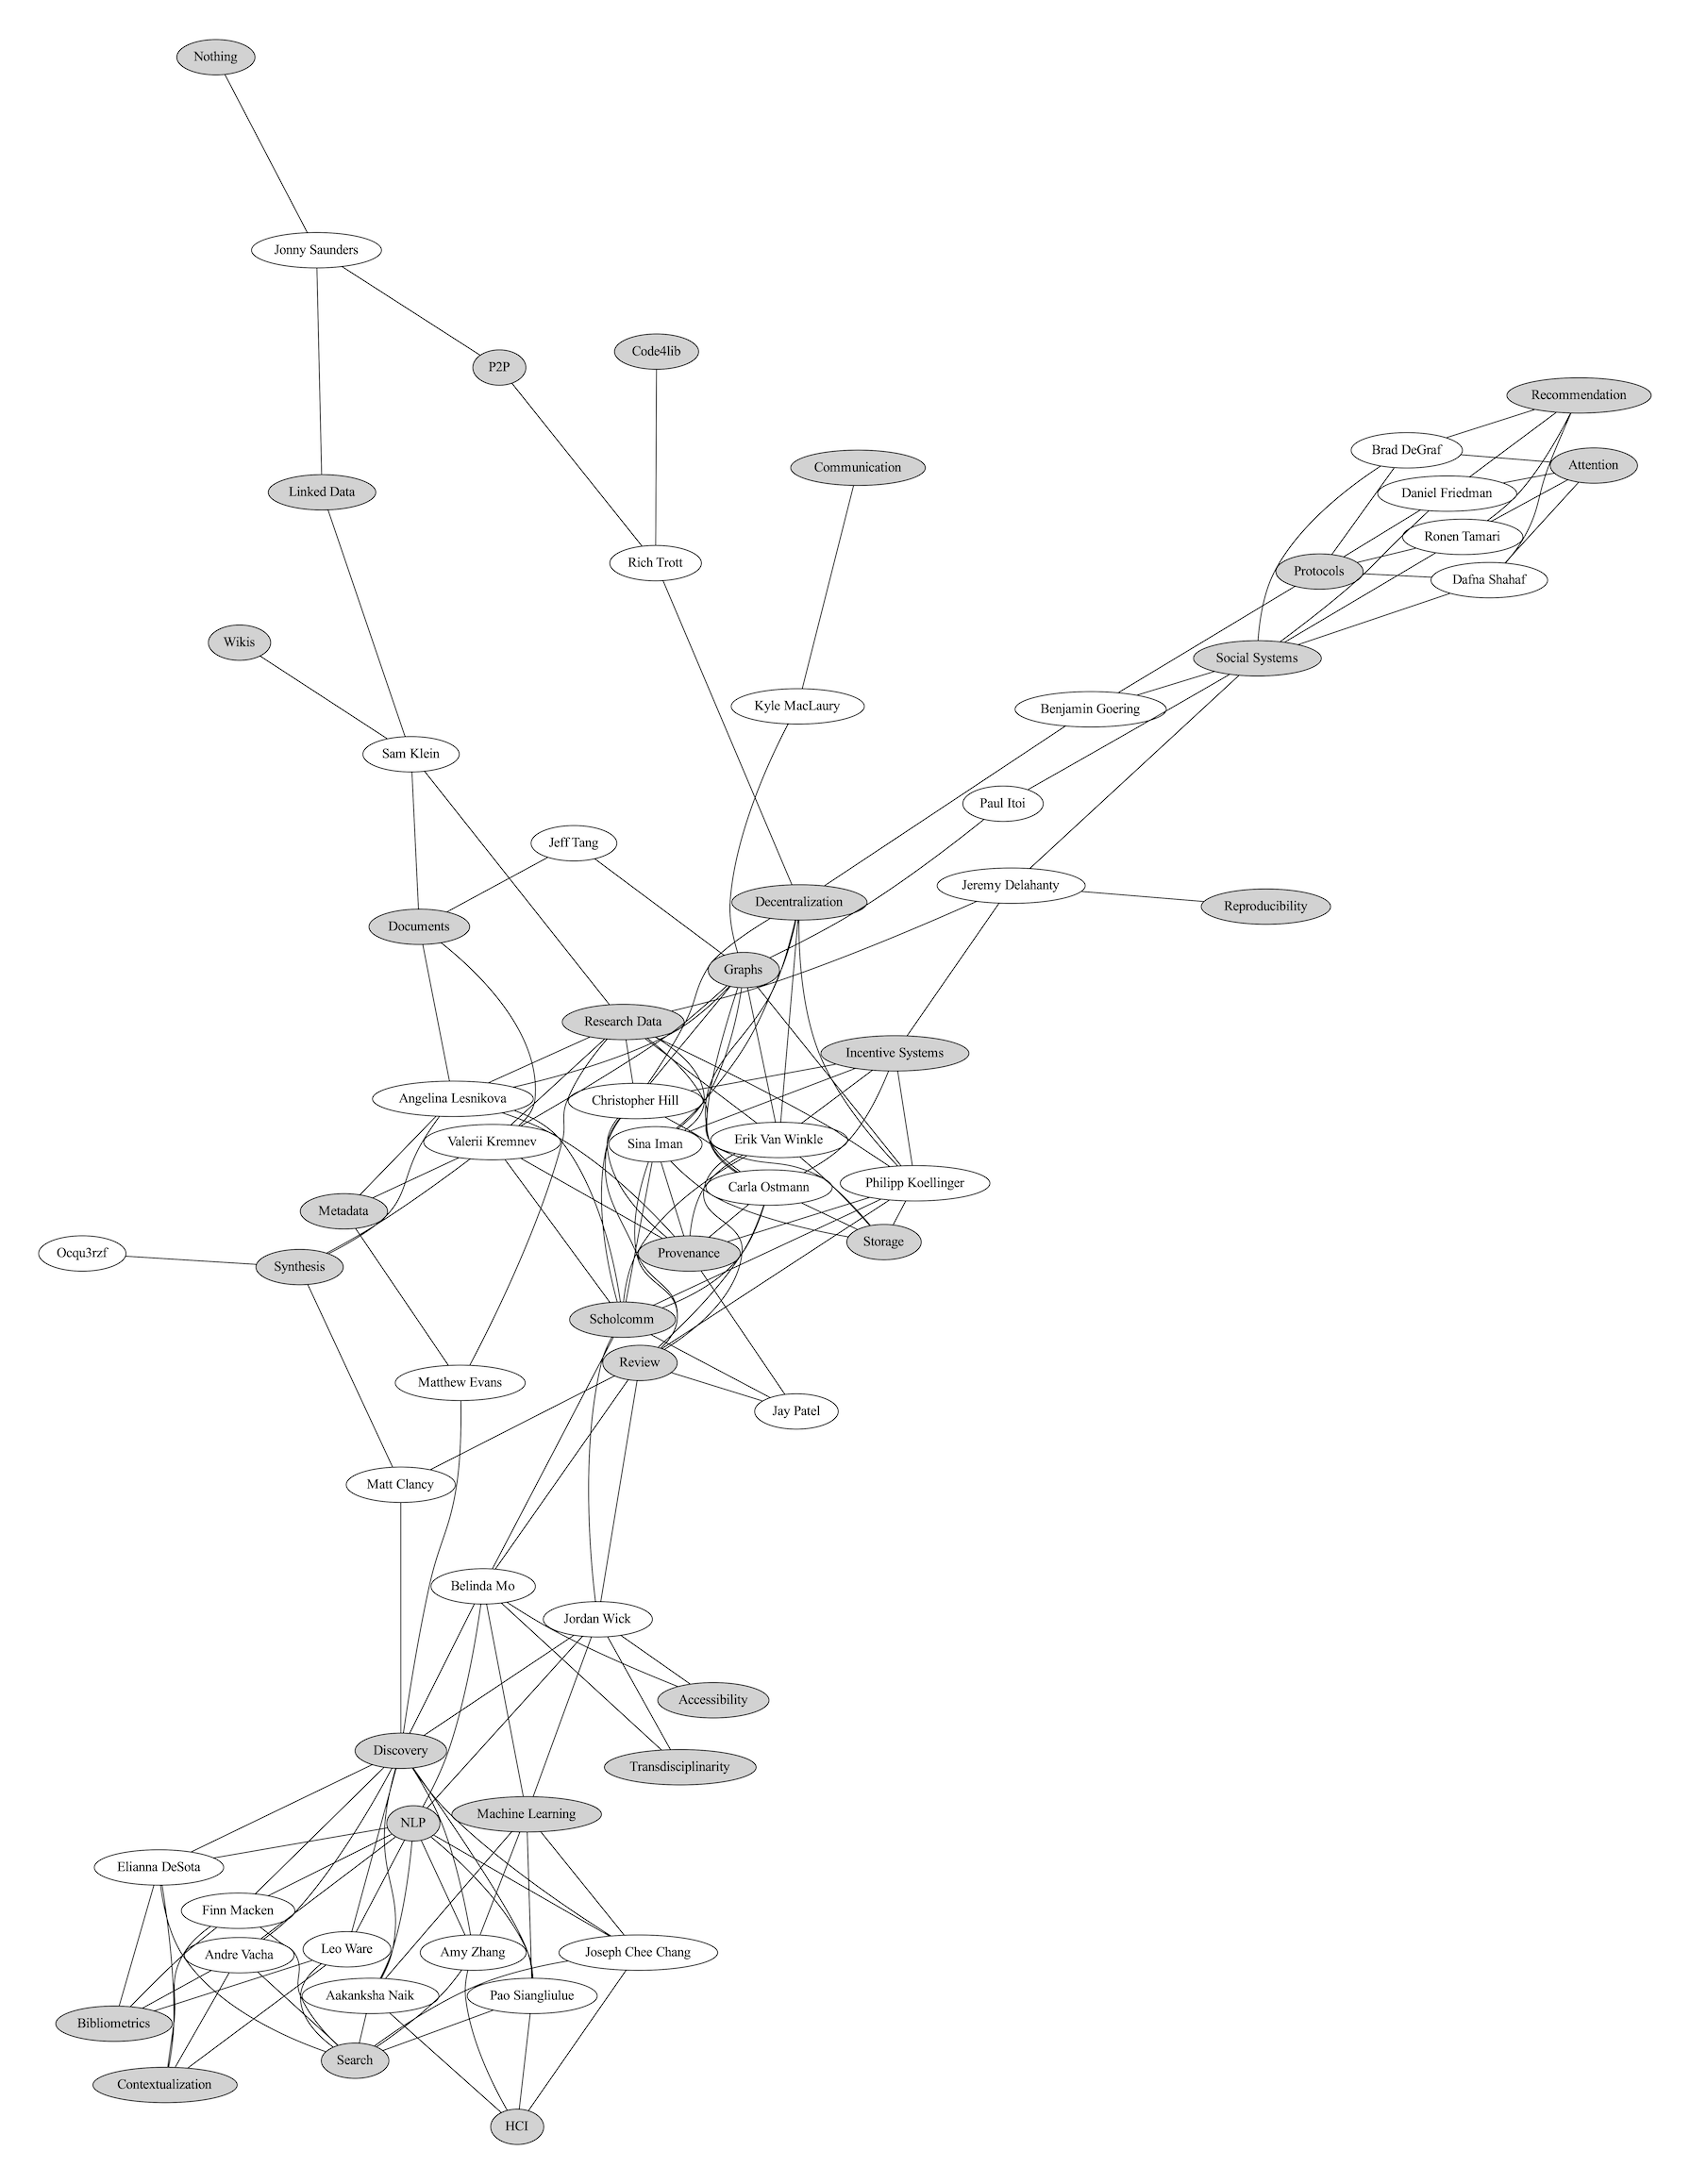
Idk some late night clustering. see ya tomorrow :)
from autopilot.utils import wiki
import requests
import graphviz
import networkx as nx
import pdb
from matplotlib import pyplot as plt


def unnest(entries:dict):
    unnested = []
    for entry in entries:
        entry_name = list(entry.keys())[0]
        nested_entry = entry[entry_name]
        unnest_entry = wiki._clean_smw_result(nested_entry)
        unnested.append(unnest_entry)

    return unnested

def to_graph(entries, key="Interested In") -> dict:
    """
    Convert unnested entries to a dict
    containing nodes and edges,
    where the nodes are the names of individual nodes within groups
    and edges connect them!

    {
    "nodes": {
       "group1": ['a', 'b', 'c'],
       "group2": ["d", 'e', 'f']
    },
    "edges": [
        ('a', 'b'),
        ('c', 'd')
    ]
    }
    """
    people = [e['name'] for e in entries]
    topics = []
    edges = []
    for entry in entries:
        interests = entry['Interested In']
        if isinstance(interests, str):
            interests = [interests]
        topics.extend(interests)
        edges.extend([
            (entry['name'], interest) for interest in interests
        ])

    topics = list(set(topics))

    return {
        'nodes': {
            'people': people,
            'topics': topics
        },
        'edges': edges
    }


def make_nx_graph(graph:dict):
    g = nx.Graph()
    g.add_nodes_from(graph['nodes']['topics'], bipartite=0, label='topics')
    g.add_nodes_from(graph['nodes']['people'], bipartite=1, label='people')
    g.add_edges_from(graph['edges'])
    left_set = nx.bipartite.sets(g)[0]
    pos = nx.bipartite_layout(g, left_set)
    nx.draw(g, pos,
        with_labels=True)
    plt.savefig('graph.pdf')

def make_graphviz_graph(graph:dict):
    g = graphviz.Graph(
        'Interests',
        filename='interests_clusters.gv',
        graph_attr={
            'splines':"true"
        },
        engine="fdp")


    # put topics in the center
    with g.subgraph(name="Topics") as a:
        a.node_attr.update(
            style="filled",
            )
        for topic in graph['nodes']['topics']:
            a.node(topic)

    with g.subgraph(name="Participants") as a:
        for person in graph['nodes']['people']:
            a.node(person)

    for edge in graph['edges']:
        g.edge(*edge)

    g.view()


def make_radial_graph(graph:dict):
    g = graphviz.Graph(
        'Interests',
        filename='interests_radial.gv',
        graph_attr={
            'root': 'topic',
            'ranksep': '3'
        },
        engine="twopi")

    g.node('topic')

    # put topics in the center
    with g.subgraph(name="cluster_Topics") as a:
        a.node_attr.update(
            style="filled",
            )
        for topic in graph['nodes']['topics']:
            a.node(topic)
            a.edge('topic', topic, color="white")

    with g.subgraph(name="cluster_Participants") as a:
        for person in graph['nodes']['people']:
            a.node(person)

    for edge in graph['edges']:
        g.edge(*edge)

    g.view()


if __name__ == "__main__":
    WIKI_URL = "https://synthesis-infrastructures.wiki/api.php?action=ask&query="

    query = wiki.make_ask_string(
        filters="[[Category:Participant]]",
        properties="Interested In",
        full_url=False)
    query = WIKI_URL + query

    res = requests.get(query, verify=False)

    data = unnest(res.json()['query']['results'])
    graph = to_graph(data)

    make_graphviz_graph(graph)

